CMP Agent#
The CMP Agent is a conversational AI assistant built into Reply CMP. Ask it questions in plain language — it queries your cloud data, runs live provider metrics and log queries, manages alert rules, and can produce formatted HTML reports — all without leaving the platform.
Opening the CMP Agent#
Click the ![]() icon in the top navigation bar. The agent panel opens on
the right side of the screen without navigating away from your current view.
icon in the top navigation bar. The agent panel opens on
the right side of the screen without navigating away from your current view.
The agent is always accessible, on every page. You can work in the main view (switching tabs, checking dashboards) while the conversation persists in the side panel.
What the Agent Can Do#
The CMP Agent covers ten capability domains.
1. Resource Discovery Queries#
Query your resource inventory — counts, filters, distributions.
Examples:
“How many Azure VMs do I have?”
“List all untagged GCP resources”
“Which resources are in the
productiongroup?”“Show distinct resource types across all connections”
2. Cloud Cost Analysis#
Query cost data with filters, group-bys, and time ranges — the same data powering the FinOps Analyze view.
Examples:
“What were our top 5 most expensive resources last month?”
“Compare this month’s Azure costs to last month”
“Show costs by connection for Q3”
“Which groups are over budget?”
3. Live Cloud Monitoring Queries#
Run live metric, log, and alert queries directly against your cloud providers — the same queries that power Monitoring dashboards.
Metrics:
“Show average CPU utilisation for my Azure VMs over the last 24 hours”
“What is the Lambda error rate for the
checkoutfunction in the last hour?”“Show GCP Cloud Run request count for the last 7 days”
Logs:
“Show the last 50 errors from the
AppServiceLogstable in Log Analytics”“Query Lambda errors from
/aws/lambda/checkoutin the last 6 hours”“Find all HTTP 5xx entries in Log Analytics from today”
Alerts / Alarms:
“Are there any active Azure alerts with severity Sev1 or higher?”
“Which AWS CloudWatch alarms are currently in ALARM state?”
“Show active GCP alert policies for Cloud Run”
Discovery tools:
“What metric namespaces are available for my Azure subscription?”
“List available metrics for Azure Kubernetes Service”
“Which Log Analytics workspaces does the agent have access to?”
4. Alert Rule Management#
Inspect and manage the Alert Rules configured in Monitoring.
Examples:
“List all alert rules — which ones are currently Firing?”
“Show the full configuration for the
prod-cpu-highalert rule”“What is the state history for the
database-latencyrule?”“Disable the
staging-error-ratealert rule”“Run an immediate evaluation of the
prod-memoryalert rule”
Note
Toggling (enable/disable) an alert rule requires the Monitoring.AlertRule / Write
permission. Read-only operations require Monitoring.AlertRule / Read.
5. Savings Recommendations#
Ask about cost savings opportunities and cloud reservations.
Examples:
“What reservations do we have expiring soon?”
“Summarise our top savings recommendations”
“What would we save if we acted on all High confidence recommendations?”
“Show ongoing Azure Reserved Instance costs”
6. Automation Policies#
Inspect automation policy definitions and active policy instances.
Examples:
“What automation policies are available?”
“List all active policy instances — which ones are enabled?”
“Show the last 10 execution runs for the
stop-dev-vmspolicy”“Which policy instances ran in the last 7 days and used the most credits?”
7. Provisioning#
Query provisioned infrastructure stacks and available catalog templates.
Examples:
“List all active provisioning deployments”
“Which catalog templates are available for Azure?”
“Show deployments that target the production connection”
8. Tenant and Platform Information#
Query platform metadata — connections, users, identity.
Examples:
“How many connections are configured?”
“List all users and their roles”
“What cloud provider is the
eu-prodconnection?”
9. Trigger Discovery#
Ask the agent to start a discovery sync for a connection. The agent will confirm with you before triggering.
Example:
“Trigger a discovery sync for the Azure production connection”
The agent responds: “Are you sure you want to trigger discovery for [connection name]?” → Type yes to confirm.
10. Report Generation#
Ask the agent to generate a full HTML report. The agent runs a multi-step AI pipeline collecting data from multiple domains and produces a styled, downloadable HTML report.
Examples:
“Generate a cloud cost report for last quarter”
“Create a monitoring health report for this month”
“Generate an advisory report with savings recommendations”
The report is delivered as a download attachment directly in the chat.
Report Generation Pipeline#
When you request a report, the Agent runs a multi-step pipeline:
Stage |
What happens |
|---|---|
1. Planning |
The agent analyses your request and plans which data perspectives to collect |
2. Data collection |
Queries relevant data across multiple dimensions (costs, groups, recommendations, monitoring…) |
3. Report writing |
A dedicated AI pass writes sections, narrative summaries, and KPI cards |
4. HTML generation |
Combines all sections into a styled HTML document with Chart.js visualisations |
Note
Report generation takes approximately 30–60 seconds. The agent will display a “Generating html report…” status indicator while processing.
Language auto-detection: The report is written in the language of your query — the same language you used when requesting the report.
Inline visualisations: For non-report answers that contain numeric data, the agent renders Mermaid diagrams (charts, pie charts, flow diagrams) directly in the chat response without generating a file.
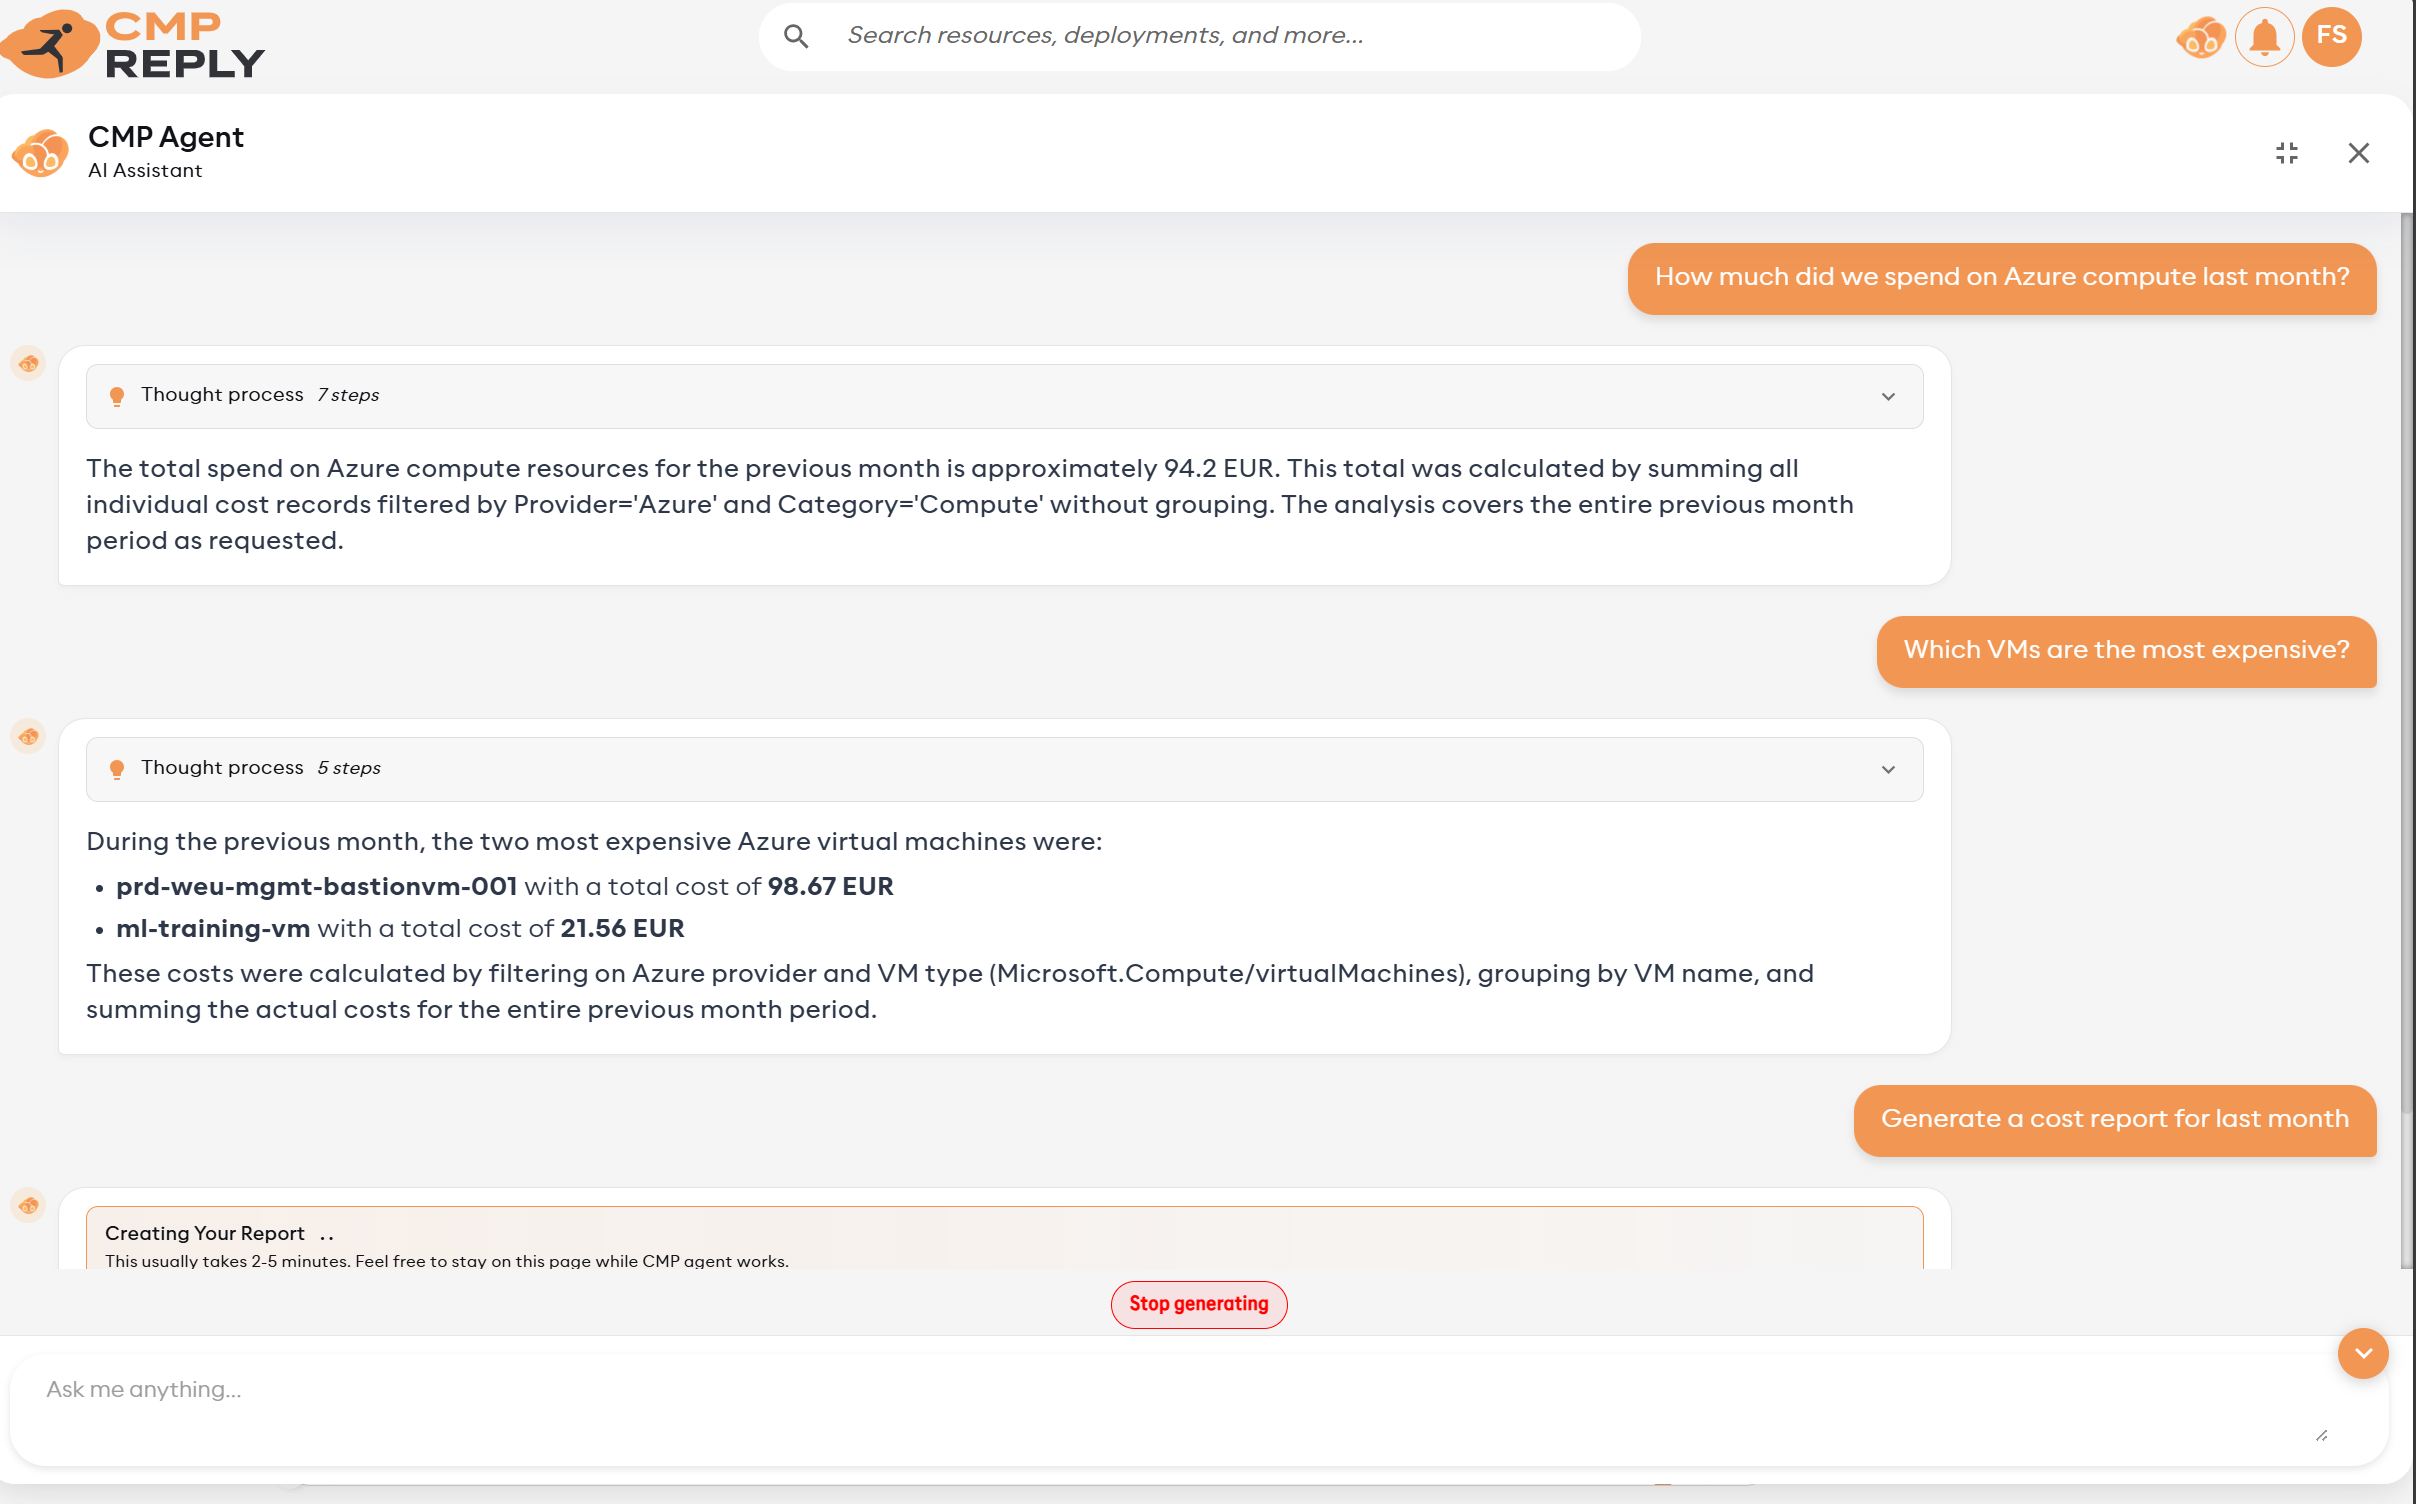
Example Conversation#
Limitations#
Limitation |
Detail |
|---|---|
T-1 cost data |
Cost and discovery data is refreshed up to the previous day. Real-time resource states are not available via cost tools. |
Live monitoring data |
Monitoring query tools ( |
No resource modification |
The Agent cannot create, edit, or delete cloud resources. Write actions are: triggering Discovery (with confirmation) and toggling alert rules (with |
Report generation time |
30–60 seconds per report. Complex queries or large tenants may take longer. |
Context window |
Long conversations may lose context from very early messages. Start a new conversation for a different topic. |
Language |
The Agent understands queries in multiple languages and always responds — including generated reports — in the language of your query. |
Permissions Summary#
Domain |
Required permission |
|---|---|
Resource Discovery |
|
Cloud Cost Analysis |
|
Live Monitoring Queries |
|
Alert Rule read |
|
Alert Rule toggle |
|
Automation Policies |
|
Provisioning |
|
Connections & Users |
|
Trigger Discovery |
|
Users with the built-in Owner, Contributor, or FinOps Contributor roles have access to all Agent domains. Users with Monitoring Reader can use live monitoring queries and alert rule read tools. See Roles & Permissions for the full reference.
Tips for Best Results#
Be specific about time ranges: “last 30 days” or “October 2025” works better than “recently”
Reference your group names: “Show costs for the Frontend group” — use your actual allocation group names
Ask follow-up questions: the Agent maintains conversation context, so “Which of those are in prod?” works after a list response
Use metric discovery first: for monitoring queries, ask “What metric namespaces are available?” or “List metrics for Azure VMs” before querying a specific metric
Specify provider for monitoring: “Show AWS alarms” or “Query Azure metrics” to avoid ambiguity when you have multi-cloud connections