FinOps
Note: Previously named “Finances”. From v0.8.0, FinOps spans assessment, allocation, analysis, optimization and monitoring.
Reply CMP FinOps helps you see where money goes across Azure, AWS, and GCP and makes it simple to hold teams accountable. You explore costs, allocate ownership with rules, and dig into drivers—all in one place.
How it works
FinOps in Reply CMP follows a lightweight lifecycle:
Assess gives you a high‑level picture of spend and trends.
Allocate maps resources to owners (Groups), Environments, and Projects, and tracks budgets.
Analyze lets you ask deeper questions with rich filters and groupings.
Optimize and Monitor bring recommendations and continuous tracking.
Note
Cost data refreshes daily and includes charges up to the previous day (T‑1). Providers often revise (backfill) prior days as usage is finalized. Reply CMP automatically reconciles these retroactive updates, so recent historical values can change slightly as providers publish corrections. Intraday data is not available.
Note
Tenant currency: You can set a preferred currency at the tenant level. All FinOps views, budgets, and exports will display amounts in this currency.
Quick start
Connect your cloud providers in Tenant → Connections.
Open FinOps from the left navigation. Use the phase selector at the top (
Assess,Allocate,Analyze).Pick a time frame (for example, Last 30 Days) and a cost type (Actual or Amortized).
Start in Assess to get the landscape, then move to Allocate to define ownership, and use Analyze to answer specific questions.
Assess
Assess is the dashboard you check first. It summarizes:
Total cost, daily average, and last‑period comparison
Cost split by provider (Azure, AWS, GCP)
Daily cost trend for anomaly spotting
Breakdown by connection, category, and group
Look for changes rather than absolutes. A sudden bump in the daily trend or a category growing faster than others is a good reason to drill down.
Tip
Click provider badges in legends to toggle series on or off and isolate a signal.
Note
Switch Cost Type between Actual (raw, daily invoiced) and Amortized (commitments spread over time) to compare perspectives.
Allocate
Allocate is where cost ownership becomes explicit.
You build three orthogonal dimensions:
Groups: your organization tree (Company → BU → Product → Team—any depth) with optional owners
Environments: standard stages like dev, qa, prod
Projects: initiatives, applications, or workloads
Resources are assigned with rules so you don’t move them manually.
Budgets live on group nodes. Set a monthly or quarterly amount and watch utilization update as new data arrives.
Budgets
Budgets help owners keep spend on track for a group node. They support both traditional (actual spending) and predictive (forecasted spending) alerts.
Where it applies:
Scope is the selected Group node; the budget evaluates all costs allocated to that node across providers and connections.
Create a budget:
Open Allocate and select a Group node.
Click Add budget.
Set Amount (currency follows your tenant settings).
Choose Reset period (for example, Monthly; other cadences may be available).
Pick a Start date.
Note
The start date is fixed after creation and can’t be changed.
Save.
What you’ll see:
Overview: Current spend this period and utilization (e.g., €569.01 • 50% of budget) with a progress bar.
Thresholds: A list of alert thresholds and their status (Triggered when crossed).
Alerts and recipients:
Configure up to three thresholds per budget.
Tip
Common picks are 50%, 75%, and 90% of budget.
Threshold type: Percentage of the budget amount (alerts fire when utilization crosses the value).
Recipients: The Group owner receives alerts by default; add additional recipients as needed.
Escalate: If escalate is enabled, also the owner of the ancestor’s group will be notified for that alert.
Editing and lifecycle:
You can update the amount, thresholds, and recipients at any time.
The start date remains fixed; the reset period rolls the budget automatically at the end of each cycle.
Forecasting & Predictive Alerts:
Budgets predict overruns before they happen using linear regression on historical spending data.
Forecast-based alerts:
Trigger: Forecasted spending at the end of the current period
Threshold types: Percentage of budget (e.g., 90%) or Absolute amount (e.g., $10,000)
When it fires: As soon as the forecast crosses the threshold, not when actual spending does
Example scenario:
You have a $5,000 monthly budget
Midway through the month, you’ve spent $2,800
Linear regression forecasts $5,200 by month-end
A 100% threshold alert fires immediately, warning you’re on track to exceed
Actual vs Forecasted alerts:
Actual: Fires when real spending crosses the threshold (traditional budget alert)
Forecasted: Fires when projected end-of-period spending crosses the threshold (predictive alert)
Use both types together for layered protection:
Forecasted alert at 90% warns you early
Actual alert at 100% is your last line of defense
Configuring forecast alerts:
Open Allocate, select a Group, and create or edit a budget
Add a threshold (e.g., 90%)
Set Trigger type to Forecasted
Add recipients
Enable Escalate to also notify the parent group’s owner
Note
Forecast alerts require at least 2 days of spending data in the current period. In the first day or two of a new budget cycle, only actual spending alerts can fire.
Email notifications: Budget alert emails include:
Current spending and utilization percentage
Forecasted spending at end of period (for forecast alerts)
Daily spending trend and recent anomalies
Recommended actions based on alert type
Link to FinOps Analyze with pre-filtered view of the group’s costs
Analyze
Analyze turns questions into views. You choose a time frame and granularity (Daily/Weekly/Monthly), then combine filters and up to two “Group by” dimensions (for example, Provider + Project or Group Level + Environment). The chart highlights trends; the table underneath gives the exact rows you can export.
Common flows:
Find top drivers: Group by Category → Resource Type; sort by cost.
Compare units: Group by Group Level + Environment to see how prod compares to dev across BUs.
Investigate a spike: Narrow the date range and group by Connection + Resource Name to isolate the source.
Tip
Use Tags in filters to align with your own taxonomy even when provider naming differs.
Optimize
Optimize surfaces cost-saving opportunities across all your cloud providers. It brings together AI-powered recommendations and reservation tracking to help you reduce waste and maximize commitment benefits.
Cost Optimization Recommendations
Reply CMP continuously analyzes your cloud resources against provider-native advisor engines (Azure Advisor, AWS Trusted Advisor, GCP Recommender) and surfaces actionable cost-saving recommendations.
How it works:
Recommendations refresh automatically via background jobs (typically daily)
Each recommendation includes:
Category: The area of optimization (VM rightsizing, storage cleanup, networking, etc.)
Impact: Potential effect level (High, Medium, Low, None)
AI-Estimated Savings: Monthly savings projection in your tenant currency
Confidence: How reliable the estimate is (High, Medium, Low)
Affected Resources: List of resources this recommendation applies to
Summary & Problem: What the issue is and why it matters
Click into a recommendation to see resource-level details and historical costs
Filtering and navigation:
Filter by Provider (Azure, AWS, GCP)
Filter by Category (Compute, Storage, Network, etc.)
Filter by Impact level
Click affected resources to jump to Discovery for full resource details
Tip
Start with High Impact recommendations where AI confidence is also High. These represent the clearest wins with minimal risk.
Provider Recommendation Engines:
Reply CMP integrates with native recommendation services from each cloud provider:
Azure Advisor (
Microsoft.AdvisorAPI)Provides cost, performance, reliability, security, and operational excellence recommendations
Scope: Subscription-level (linked via ARM)
Categories: Compute (VM rightsizing, idle resources), Storage (orphaned disks, blob tiers), Networking (ExpressRoute, Traffic Manager), Databases (DTU/vCore sizing), Reserved Instances suggestions
Refresh: Advisor updates daily; Reply CMP syncs recommendations once per day
AWS Trusted Advisor (Cost Optimization Checks via Support API)
Available on Business/Enterprise support plans (core checks on all plans)
Scope: Account-level
Categories: Idle/Underutilized EC2/RDS/EBS, unassociated Elastic IPs, unused load balancers, EC2/RDS Reserved Instance recommendations
AWS Compute Optimizer provides additional rightsizing guidance (requires opt-in)
Refresh: Trusted Advisor updates weekly; Reply CMP syncs every 24 hours
Google Cloud Recommender (Recommender API)
Provides recommendations across compute, storage, IAM, billing, networking
Scope: Project-level (via Cloud Asset Inventory and Recommender API)
Categories: VM rightsizing (Compute Engine), idle resources, persistent disk snapshots, commitment use discounts (CUD) suggestions, BigQuery BI Engine
Refresh: Recommender updates continuously; Reply CMP syncs daily
Note
If you don’t see recommendations, verify the provider’s native service is enabled:
Azure: Advisor is enabled by default for all subscriptions
AWS: Trusted Advisor requires Business or Enterprise support for full checks; ensure AWS Health API is accessible
GCP: Enable the Recommender API (
recommender.googleapis.com) and grantroles/recommender.viewerto your service account
AI-Powered Savings Estimation
Unlike static heuristics, Reply CMP uses Azure OpenAI to estimate savings by analyzing:
Actual resource costs from your billing data (last 30 days)
Recommendation context (what action is suggested, e.g., delete, resize, region change)
Resource metadata (type, region, configuration)
Usage patterns (idle resources, underutilized capacity)
Confidence levels explained:
High: Good cost data available, clear action path, provider gives explicit savings guidance
Medium: Partial cost data or recommendation requires nuanced interpretation
Low: Insufficient cost data or high uncertainty in outcome
Example estimates:
Delete unused resources: 100% of resource cost (High confidence)
Resize VM from D4s to D2s: ~50% cost reduction (Medium-High confidence)
Consolidate idle NAT gateways: Full gateway cost minus expected data transfer (Medium confidence)
See also
Savings are displayed in your tenant currency. When resources have costs in native provider currencies, Reply CMP applies daily exchange rates for conversion.
Reservations
Reservations (Azure Reserved Instances, AWS RIs/Savings Plans, GCP Committed Use Discounts) provide cost savings in exchange for commitment. Reply CMP tracks their lifecycle and shows their impact on your total spending.
Lifecycle stages:
Detection: Reply CMP detects a new reservation when first payment appears in billing data
Ongoing: Active reservation with regular payments
Settled: Reservation has expired or been fully paid (no new payments expected)
What you’ll see:
Reservation ID: Provider-assigned identifier
Connection: Which subscription/account/project the reservation is associated with
Provider: Azure, AWS, or GCP
Payment Status: Ongoing or Settled
Start Date: When the reservation began
Last Payment Date: Most recent charge observed
Last Cost (USD): Amount of the last payment
Amortization by provider:
Azure: Costs automatically split between actual (pay-as-you-go) and amortized (RI benefit spread over time)
AWS: RI fees and Savings Plan charges appear separately; Reply CMP categorizes them as Reservation cost type
GCP: CUD benefits already reflected in usage costs; subscription ID links the commitment
Provider-Specific Reservation Types:
Azure Reserved Instances (RIs)
Scope: Virtual Machines, SQL Database, Cosmos DB, Synapse Analytics, App Service, Storage
Terms: 1-year or 3-year commitments
Payment: All Upfront, Partial Upfront, or Monthly
API: Azure Cost Management Query API (
ActualCostandAmortizedCostqueries)Reply CMP tracks: Reservation orders, RI IDs, utilization, expiry dates
AWS Reserved Instances (RIs) & Savings Plans
Reserved Instances: EC2, RDS, ElastiCache, Redshift, OpenSearch (formerly Elasticsearch)
Savings Plans: Compute Savings Plans (flexible across EC2, Fargate, Lambda), EC2 Instance Savings Plans
Terms: 1-year or 3-year commitments
Payment: All Upfront, Partial Upfront, No Upfront
API: AWS Cost Explorer API (
GetReservationUtilization,GetSavingsPlansUtilization)Reply CMP tracks: Reservation ARNs, Savings Plan ARNs, utilization %, expiry dates, hourly commitment rates
Google Cloud Committed Use Discounts (CUDs)
Scope: Compute Engine (vCPU/memory), BigQuery (slot reservations), Cloud SQL
Terms: 1-year or 3-year commitments
Payment: Monthly (no upfront option)
API: BigQuery billing export (commitment charges appear in usage data), Cloud Billing Catalog API
Reply CMP tracks: CUD subscription IDs, commitment amounts, start/end dates, utilization
Tip
Compare Actual vs Amortized cost type in Analyze to see how reservations impact your daily spending vs long-term average.
Monitor
Monitor provides customizable dashboards and intelligent alerts so you stay informed without constant manual checking.
User Dashboards
Build your own FinOps dashboards tailored to your role, team, or reporting needs.
Key features:
8 widget types: Cost Summary, Cost Trend, Budget Status, Top Spenders, Provider Breakdown, Category Breakdown, Savings Opportunities, Anomalies
Drag-and-drop builder: Resize, reposition, and configure widgets in a 12-column grid
Personal and shared: Dashboards are private by default; share with view or edit permissions
Default dashboard: Set your preferred dashboard to load automatically when you open Monitor
Creating a dashboard:
Click Create Dashboard in the Monitor tab
Name your dashboard (e.g., “Weekly Cost Review”)
Add widgets from the widget library (click Add Widget and choose type)
Configure each widget:
Time range: Last 7 days, Last 30 days, This Month, etc.
Cost type: Actual or Amortized
Filters: Providers, Connections, Groups, Environments, Projects, Categories
Grouping: How to slice the data (e.g., by Provider, by Group, by Category)
Arrange widgets by dragging; resize by pulling corner handles
Save
Sharing a dashboard:
Open the dashboard you want to share
Click Share (top right)
Search for users or select from list
Choose permission: View (read-only) or Edit (can modify layout and filters)
Send
Recipients will see the shared dashboard in their “Shared with Me” section.
Async Operation Tracking
Long-running operations (discovery, cost refresh, deployments, report generation) are tracked centrally so you know their status without checking multiple pages.
Where to see operations:
Notifications panel (bell icon, top right)
Async Operations page (accessible from user menu → Operations)
Operation types:
Discovery: Provider resource scan (typically 2-10 minutes depending on resource count)
Cost Refresh: Billing data ingestion and reconciliation (5-30 minutes for large tenants)
Apply Deployment: Provisioning execution (variable, depends on deployment complexity)
Trigger Report: Report generation and delivery (1-5 minutes)
States:
Pending: Queued, waiting for background job to pick it up
Running: In progress
Completed: Finished successfully
Failed: Encountered an error (details in notification)
Cancelled: Manually stopped or timed out
Hanging operation detection: A background watcher function scans for operations stuck in Pending or Running for longer than expected (e.g., >1 hour for discovery). If detected, you’ll receive a notification and the operation is flagged for investigation.
Tip
Use async operations history to audit who triggered what and when, especially useful for compliance and troubleshooting.
CMP Agent (Conversational FinOps Assistant)
Ask natural‑language questions from within FinOps and get an immediate breakdown. The agent can analyze costs, answer queries, and generate reports on demand. Useful for quick checks, sharing context in chats, or creating formatted reports.
Example prompts:
“Provide a breakdown of costs for my groups in the last week.”
“Show monthly VM costs by region for prod.”
“Which resource group had the highest spend last month? List the top 5 resources.”
“Filter to GCP and show storage category spend by project.”
“Generate a cost report for the Azure production environment for last month.”
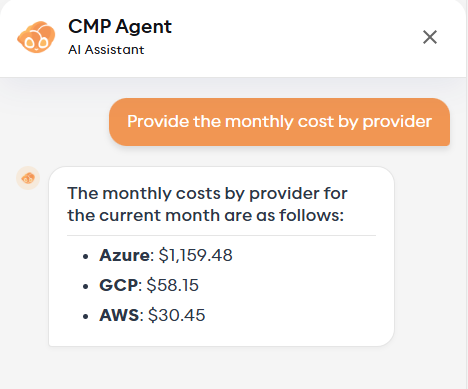
CMP Agent embedded in FinOps for quick, conversational queries.
Provider-Specific Cost Data
Azure
API: Azure Cost Management Query API
Cost data is retrieved directly from Azure’s Cost Management service, which aggregates usage and billing information at the subscription level.
Granularity: Daily, by ResourceId
Cost types:
Usage: Regular pay-as-you-go charges (PricingModel is empty or “On Demand”)
Reservation: Azure Reserved Instance charges (PricingModel = “Reservation”)
Uses ReservationName as the resource identifier instead of actual resource ID
Reservation costs show both Actual (upfront payment on purchase date) and Amortized (benefit spread over reservation period)
Discount: Azure Hybrid Benefit, promotional credits
Tax: Tax charges
Other: Unattributed or miscellaneous costs
Currency: Always returned in USD (Cost Management API converts automatically)
Data retrieval: Pulls both ActualCost and AmortizedCost separately, then joins them for dual perspective views
AWS
API: AWS Cost Explorer API (two endpoints)
AWS provides two levels of cost granularity:
Connection-level costs (last 12 months):
Via
GetCostAndUsageAPIGroups by
LINKED_ACCOUNTdimension (for AWS Organizations)Returns both
UnblendedCostandAmortizedCostmetricsAll costs categorized as Other (no resource-specific attribution at this level)
Resource-level costs (last 14 days only):
Via
GetCostAndUsageWithResourcesAPIPrerequisite: Cost Allocation Tags must be enabled at the payer/management account
Groups by
RESOURCE_ID(ARN) andRECORD_TYPEdimensionsCost type categorization based on
RECORD_TYPE:Usage:
Usage,DiscountedUsage,SavingsPlanCoveredUsageReservation:
RIFee,SavingsPlanRecurringFee,SavingsPlanUpfrontFee,FeeDiscount:
Discount,BundledDiscount,SavingsPlanNegationTax:
TaxOther:
Credit,Refund,Support, and other non-resource charges
Currency: Always USD (no conversion needed)
Limitations:
Resource-level costs only available for last 14 days (AWS limitation)
Connection-level costs available for last 12 months but without resource attribution
Note
To get resource-level costs in AWS, ensure Cost Allocation Tags are enabled in your payer/management account billing settings.
GCP
API: BigQuery (billing export table)
GCP exports all billing data to BigQuery, which Reply CMP queries directly for maximum detail and accuracy.
Table: {billingProject}.{dataset}.{table} (configured at connection time)
Cost types:
Usage:
cost_type = 'regular'Reservation: Committed Use Discounts (indicated by
subscription.instance_id IS NOT NULL)Tax:
cost_type = 'tax'Discount: Credits from the
credits[]arrayOther: Spot/Preemptible instances, adjustments, rounding errors
Currency conversion:
GCP billing export provides costs in original currency (EUR, GBP, etc.)
currency_conversion_ratecolumn converts to USDReply CMP then applies tenant currency conversion (USD → tenant currency)
Timezone: GCP billing data uses America/Los_Angeles (Pacific Time) for timestamps
Resource ID mapping:
GCP uses numeric resource IDs (e.g.,
12345678901234567890)Reply CMP maps these to friendly names via Cloud Asset Inventory during discovery
Cost rows are joined with discovered resources by
resource.global_name
Advantages:
Most detailed cost data of all three providers
Native alignment with GCP billing (no API transformations needed)
Access to full billing export schema for custom analysis
Exchange Rates
Tenant currency: All costs are displayed in the tenant’s reporting currency (configured in Tenant settings)
Exchange rate application:
Azure: Applied on the cost date (the day the charge was incurred)
AWS: Applied at the end of the billing period (monthly aggregation)
GCP: Applied at the start of the month (BigQuery billing export uses monthly rates)
Rate source: Reply CMP uses daily exchange rates from a financial data provider, cached and refreshed daily
Data timeline: Why “yesterday”?
See also
Costs refresh daily and typically include charges up to the previous day (T‑1). Cloud providers may publish corrections for the past 48–72 hours (backfills) as usage is finalized and commitments/credits are applied. Reply CMP ingests and reconciles these updates automatically, so recent historical values can adjust slightly over a few days. Intraday cost data is not available.
Currency and FX
Note
FinOps displays all amounts in your tenant currency. When providers export costs in native currencies, Reply CMP applies daily FX rates and standard rounding. Small differences versus provider portals can occur due to timing and rounding.
FAQ
How fresh is the data?
Daily, up to the previous day (T‑1). Providers may backfill previous days as they finalize billing; Reply CMP applies those corrections automatically, so values for recent days can change slightly. Intraday data is not available.
Why do past days sometimes change?
Cloud providers finalize and correct charges after initial export (for example, late usage arrival, commitment/reservation allocation, credits/adjustments). When those backfills are published, Reply CMP ingests and reconciles them, updating affected historical days to keep totals accurate.
Which currency is used? Can I change it?
All costs and budgets are shown in the tenant currency. An administrator can change the tenant currency in Tenant settings; once updated, the new currency is applied consistently across FinOps views and exports.
Actual vs Amortized—what’s the difference?
Actual shows the raw, daily invoiced cost. Amortized spreads committed costs across their benefit period.
What is connection‑level cost?
Overhead tied to a subscription/account/project rather than to a named resource (e.g. reservations, bandwidth costs, …). It’s shown separately and can be allocated.
Can a resource match multiple rules?
Yes. Dimensions are orthogonal. A resource can map to a Group node, an Environment, and a Project at the same time.
Can I export results?
Yes. Use Share or Export from Analyze to take the table elsewhere.
Glossary
Connection: a cloud account/subscription/project.
Category: normalized cost family (compute, storage, network, etc.).
Group: an organizational node with optional owner and budget.
Rule: one or more
key:valuetag matches that drive allocation.Connection‑level cost: provider/account overhead not tied to a specific resource.